The transformation of the television landscape over the past decade has been seismic. Accessibility of connected TV and expansion of streaming apps and platforms started the revolution, but the shift toward streaming accelerated during the pandemic, compounding into a 94% increase in share of time between 2019-2022.
What TV Landscape changes happened this year?
January 2022 marked a major turning point in the TV measurement landscape as Nielsen made a massive change to how they measure TV with a deliberate initiative to move away from ratings and toward impression-based buying. In conjunction with this change, they began including a broadband only (BBO) homes figure that captures cord-cutting homes that access TV content solely through their internet connection. In today’s fragmented media landscape, this change was necessary to provide a more holistic view of shifting TV viewing patterns and provide more context around the reach of different viewing environments.
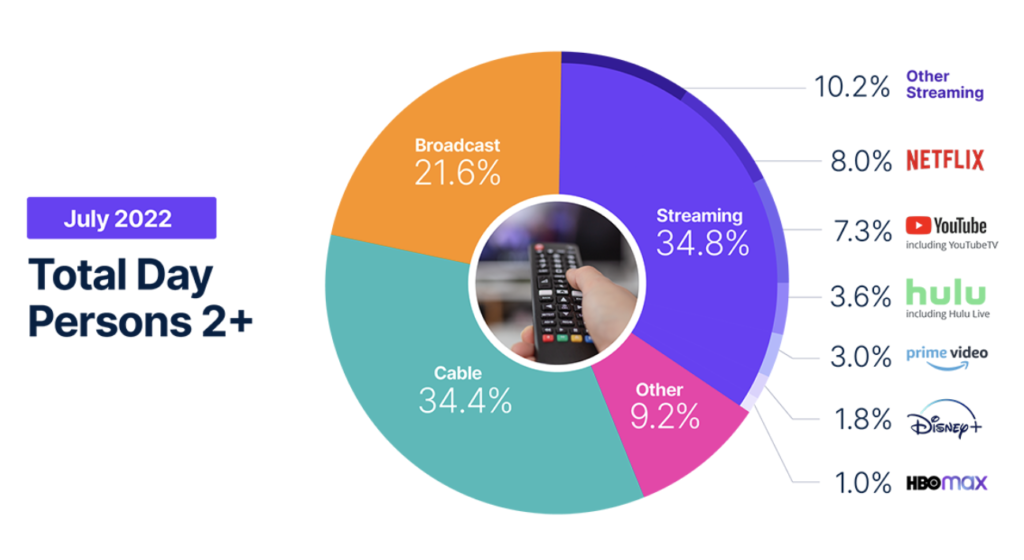
Then came July 2022. The month marked the first time in history that streaming officially surpassed cable viewing. Streaming usage has surpassed that of broadcast before, but this is the first time it has also exceeded cable viewing. The YOY changes were the largest seen to date with 9-10% of each cable and broadcast viewing shifting toward streaming.
With the growth of streaming comes even more fragmentation with various streaming options and platforms available. Top players in the streaming category are Netflix, YouTube, Hulu and Amazon Prime and account for 62% of all streaming viewing.
YoY% Change: Broadcast -9.8%; Cable -8.9%; Streaming + 22.6%
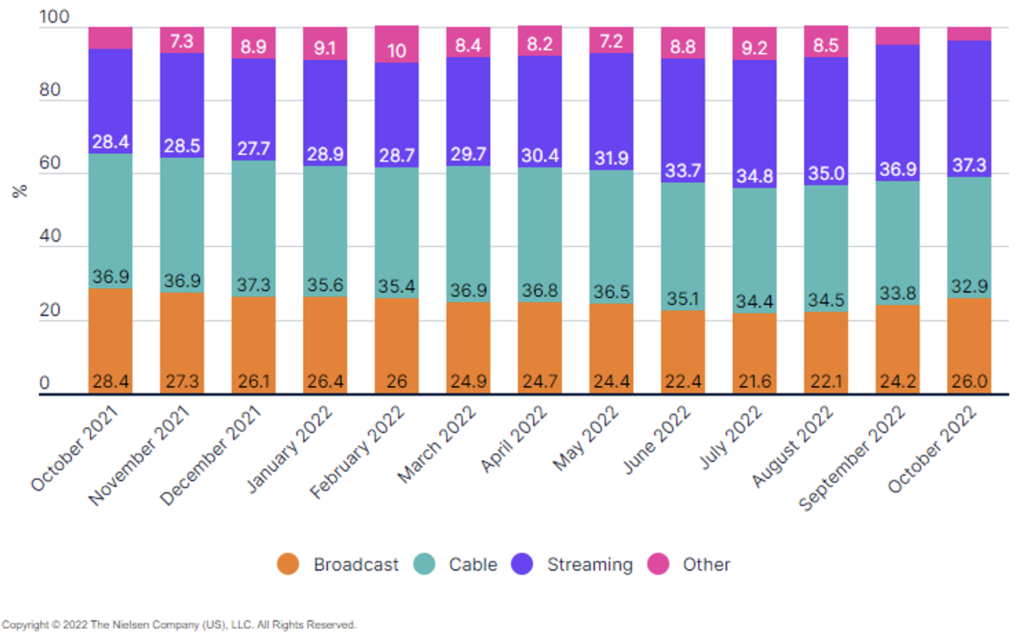
Is there any seasonality to viewing?
The short answer is yes! Overall, what this data below shows is that streaming continues to gain share month over month, at the expense of broadcast and cable. Streaming saw its largest gains over the summer, cable continued to decline month over month, and broadcast rebounded in the fall with the arrival of the football season and influx of new programming. While the return of football provided new content across all three viewing environments, broadcast attracted the biggest audiences and saw the largest gains (222% increase in sports viewing on broadcast channels). Despite the gains, broadcast usage during the month of October was still down 6.2% from a year ago.
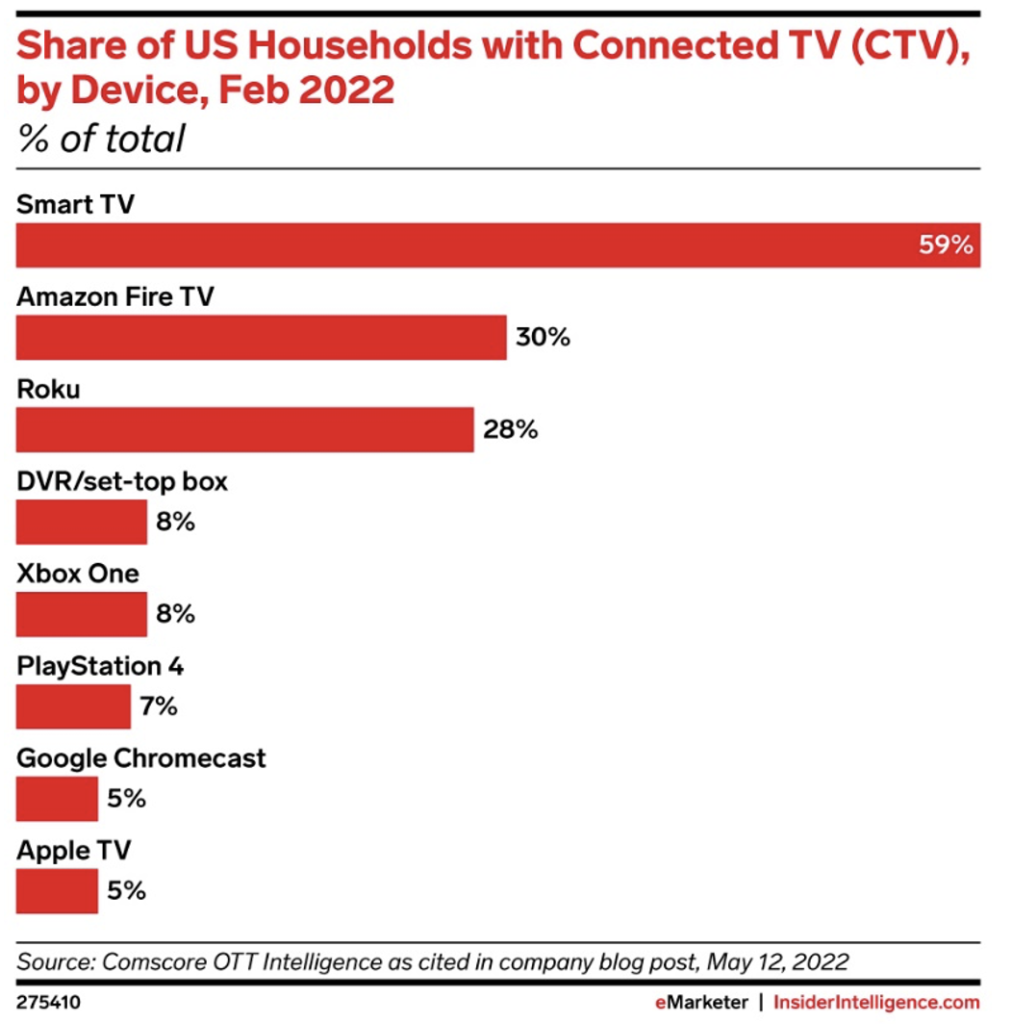
How are consumers accessing streaming content?
Smart TVs dominate as the top device that consumers are using to access streaming programming, followed by Amazon Fire TV and Roku.
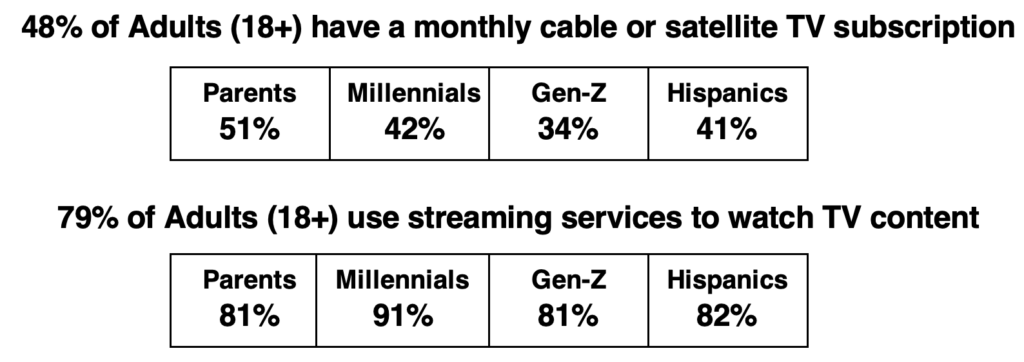
How do TV viewing behaviors vary across audience segments?
While the shift to streaming has become ubiquitous across every age group, age has the largest impact on the volume in which behavior has shifted. Overall, we have seen those age 50+ have highest usage of broadcast and cable and those under age 40 have the highest usage of streaming. Below are some high-level takeaways of how behavior has changed among some key audiences.
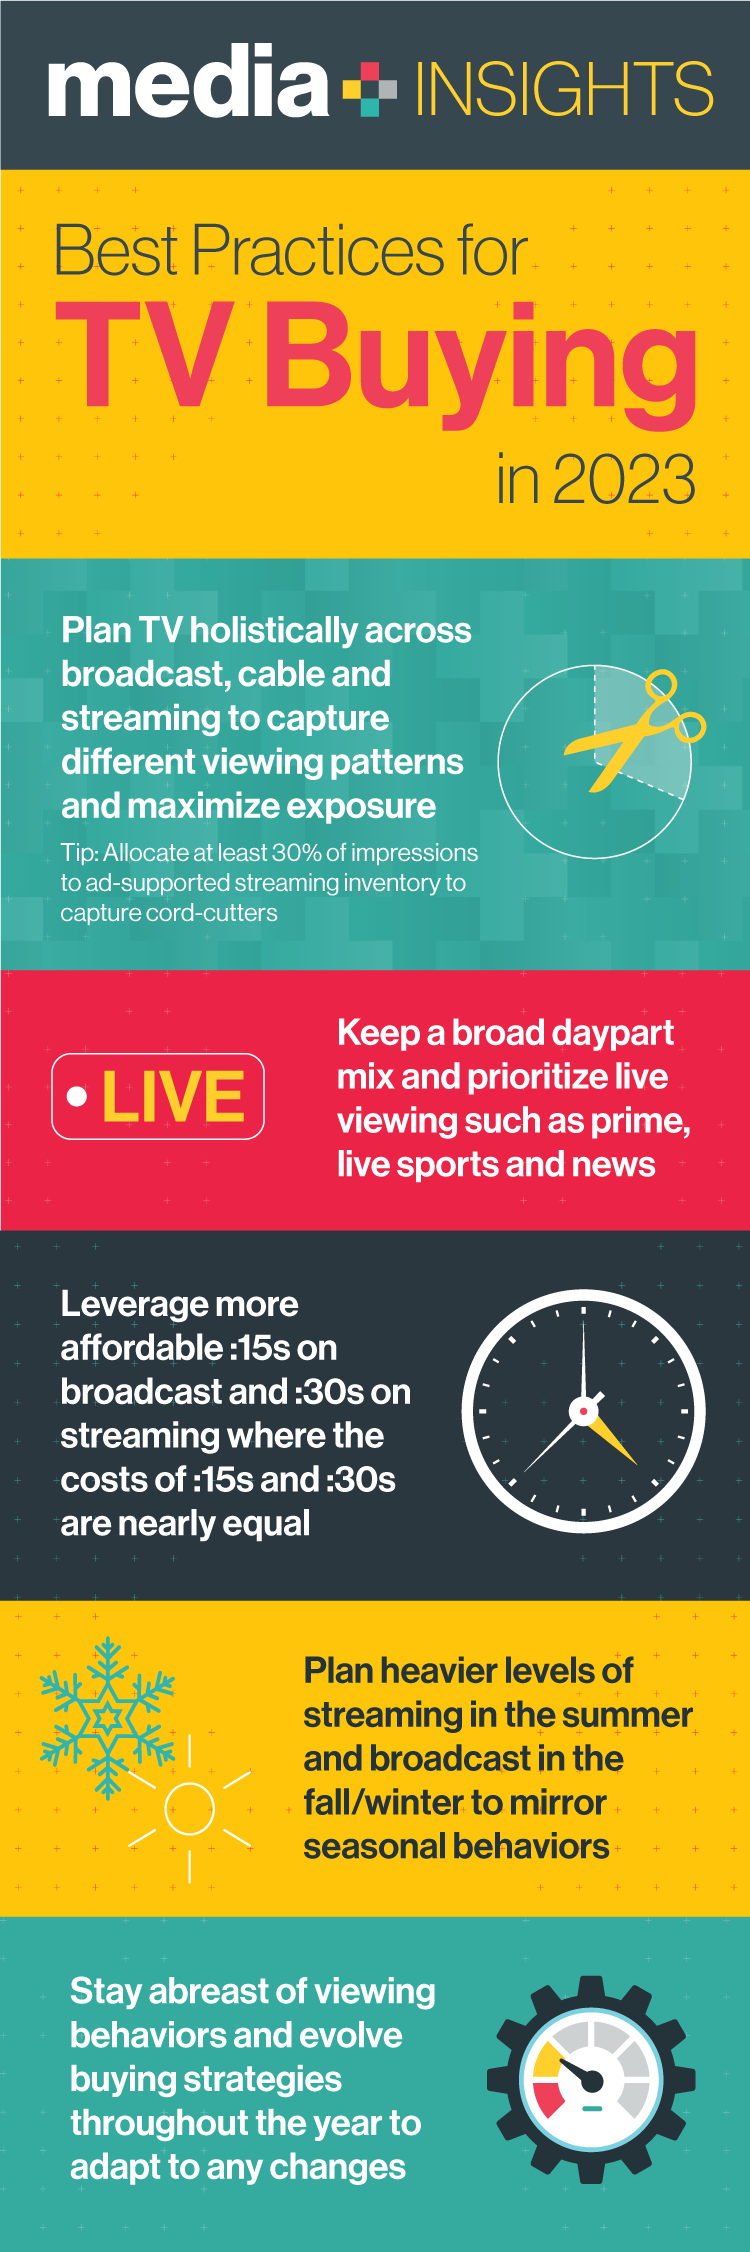
What does this mean for your media buys?
While it is apparent that people are spending more and more time on streaming video services/platforms, much of that viewing is not currently ad supported, whereas the large majority of broadcast + cable can reach audiences with ads, adding yet another complexity to the landscape.
It will likely be several more years before the industry has a clearer picture of how all these platforms play to each other. In the meantime, we have some tips and best practices for how to navigate TV buying in this ever-changing landscape.
Sources: 2022 Samba TV x Harris Holiday Viewing Report; Nielsen – The Gauge; eMarketer – Insider Intelligence